
物联网平台与连接系统套件
数字孪生可视化
数字孪生可视化把实时数据接入现场资产模型做空间可视化,让模型持续与真实工况同步。
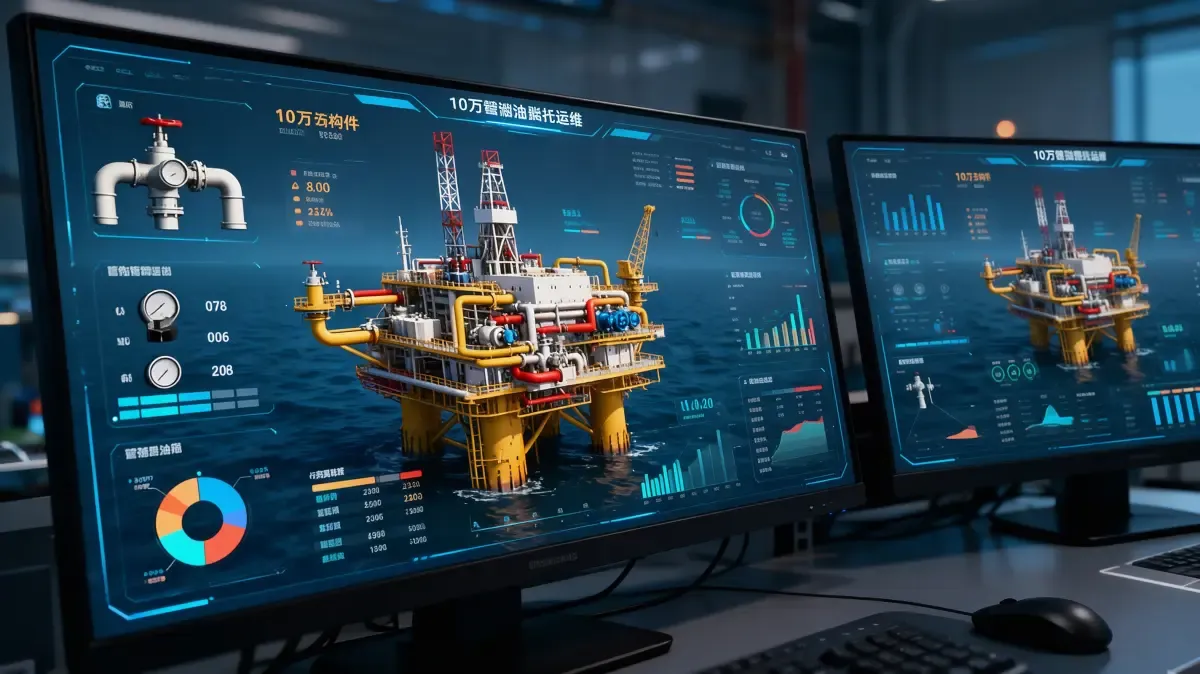
大多数工厂不缺仪表盘。缺的是一种知道「事情发生在哪里」的方式。数值以图表和表格的形式到达,读它们的人必须把工厂布局装在脑子里,才知道哪个数值要紧。
数字孪生可视化把实时数据绑定到厂区的模型上——设备、产线、区域以及它们之间的关系。你看着设备在哪里,就看到它在那里正在做什么;当问题需要落到单个单元时,再向下一层。
模型的好坏取决于挂在上面的东西。能展示什么,取决于可用的模型资产及其背后的数据。软件让两者持续关联并保持最新;模型和数据都支撑不了的细节,它不会凭空编造。
图表告诉你有什么变了。模型告诉你变在哪里。
它是什么
A structure, not a wall of charts. Areas, lines and equipment are placed where they actually are, with the relationships between them.
State shown on the equipment. Running condition, key values and faults appear at the position of the unit they belong to, rather than in a list somewhere else.
From overview down to one unit. Site, area, line, equipment — go as deep as the question needs, without switching system.
A moment you can go back to. Replay what the site looked like at a point in time, which is what an incident review actually needs.
Built on the same device record. It reads the device record held by RUIYI IOTS Platform rather than connecting to equipment separately.
Model assets come from you. 布局、设备清单及既有图纸或模型由现场提供;软件为其挂接实时数据。
当下的阻碍是什么
Charts without location. 数字来了,该归到哪里全靠看的人自己猜。
数值以图表呈现,却不说明它在厂区哪个位置。重要性只能靠记忆判断。要知道哪个读数重要,先得熟悉布局。新人不了解,老员工则装在脑子里。不同区域同名读数容易混淆。屏幕上没有任何信息说明谁是谁。
Finding one thing takes too long. 答案存在,却难以触达。
事件发生时,排查要在多块屏幕间进行。每块只显示画面的一角。人们在控制画面、报表与表格之间切换,再靠手工拼凑现场情况。现场的人与办公室的人看到的各不相同。对话要先从统一「在说什么」开始。
模型过期失效。买了一次,然后被抛在后面。
A three-dimensional model was built, but nothing live was attached to it. So it became a demonstration rather than a tool.
The line was rearranged and the model was not. So people stopped trusting it, then stopped opening it.
Whoever maintained it has moved on. 而更新它也不是任何人的职责。
不同的人,不同的画面。没有一个可以围着讨论的共同视图。
生产、维护与工程各用各的画面。每个人带来的现场情况版本都不相同。会议先花时间对齐三套数字。然后才谈得上决策。不在现场的人完全看不到工厂。而需要帮忙的往往正是这些人。
它展示了什么
四个层级,同一份数据在其中任何一层都可读。
层级 | 该层显示什么 |
厂区 | 工厂整体:哪些区域在运行,哪些需要关注 |
区域 | 一栋建筑或一个分区:产线与公用设施及其当前状态 |
产线 | 一条生产线:设备顺序排列,以及卡点所在 |
设备 | 单台设备:状态、关键数值、故障与近期历史 |
模型能展示什么,取决于有什么可用来展示。厂区有布局图、设备清单或三维模型的,就用它们作底。没有的,就基于设备台账构建结构化表示。画面的精细度跟随可用资产——软件把数据附着到任何存在的模型上,并清楚标注哪些是实时值、哪些是最后已知值、哪些不可用。
您将获得
应用场景
在这些场景之间变化的,是模型由什么构建,以及哪一层被用得最多。
场景 | 可视化通常的用途 |
流程工厂 | 沿容器、管线与公用设施的路径追踪,查看工况所在 |
离散制造 | 产线状态一目了然,可下钻到卡点的设备 |
多站点集团 | 以一致方式查看任何工厂,比较不依赖本地习惯 |
新线与调试 | 产线建设期提供共享画面,现场与场外人员同看一套 |
公用设施与基础设施 | 分布式资产按地理位置呈现,无需依附单一建筑 |
核心能力
按职能划分。数据来自锐益 IOTS 物联网平台;本应用关注的是这些数据如何呈现与浏览。
Capability | What it means |
Site structure | Model areas, lines and equipment as they are arranged in reality, and keep that structure in step with the device record. |
State on the model | Show running condition, faults and status at the position of each unit. |
Values in place | Display the readings that matter for a unit without leaving the view of it. |
Level navigation | Move from site to area to line to equipment, and back, without losing context. |
Replay | Return to a point in time and see what the site looked like then. |
Alarm display | Mark what needs attention on the equipment concerned, and let it be opened from there. |
Comparison view | Put two periods, two lines or two plants side by side on the same structure. |
Geographic view | Place distributed assets on a map where a building layout does not apply. |
Model asset handling | Use drawings, equipment lists or three-dimensional models supplied by the site as the base. |
Fidelity marking | Distinguish live values from last-known ones, and show clearly where data is not available. |
Annotation and sharing | Mark a view, add a note, and share it so discussion happens around the same picture. |
Roles and views | Give different roles the view they need, from an overview to a maintenance detail. |
Data source binding | Bind model elements to the points and devices held in the platform, with the binding recorded. |
Change tracking | Record changes to the model, so what changed and when can be answered. |
部署方式选择 | Run in the cloud or on site, usually decided by where operational data may be processed and stored. |
Access and retention | Role-based access, retention set by policy, with access logged. |
工作原理
搭好结构。区域、产线与设备按实际布局排布,数据来自平台已有的设备台账。挂接模型。现场提供的图纸、设备清单或三维模型,在存在时作为视觉底座。绑定数据。每个元素绑定到背后的测点与设备,并记录绑定关系。显示状态。状态、数值与故障就地显示,无论正在查看哪一层。导航与回放。需要时下钻到单台设备,或回溯到某个时刻查看当时发生了什么。保持更新。设备台账的变更自动流向模型,画面不会落后于工厂。
它依赖什么
模型素材。画面能做到多细,取决于现场能提供什么——布置图、设备清单或既有三维模型。软件不会凭空造出不存在的细节。背后的数据。画面显示的是设备通过平台上报的内容。没有传感器产生的数值不会出现,无数据的元素会被如实标记,而非随意填充。更新程度。画面与工厂的贴合程度取决于底层数据的更新频率——这是配置与设备的问题,不是显示层面的承诺。不做什么。它做呈现与导航。不控制设备,也不取代背后的控制系统或维护流程。数据属地。运行数据在何处处理与存储、谁可查看哪些视图、留存多久,取决于司法辖区与现场要求,配置将据此设定。