
IoT Platform & Connection System Suite
Digital Twin Visualization
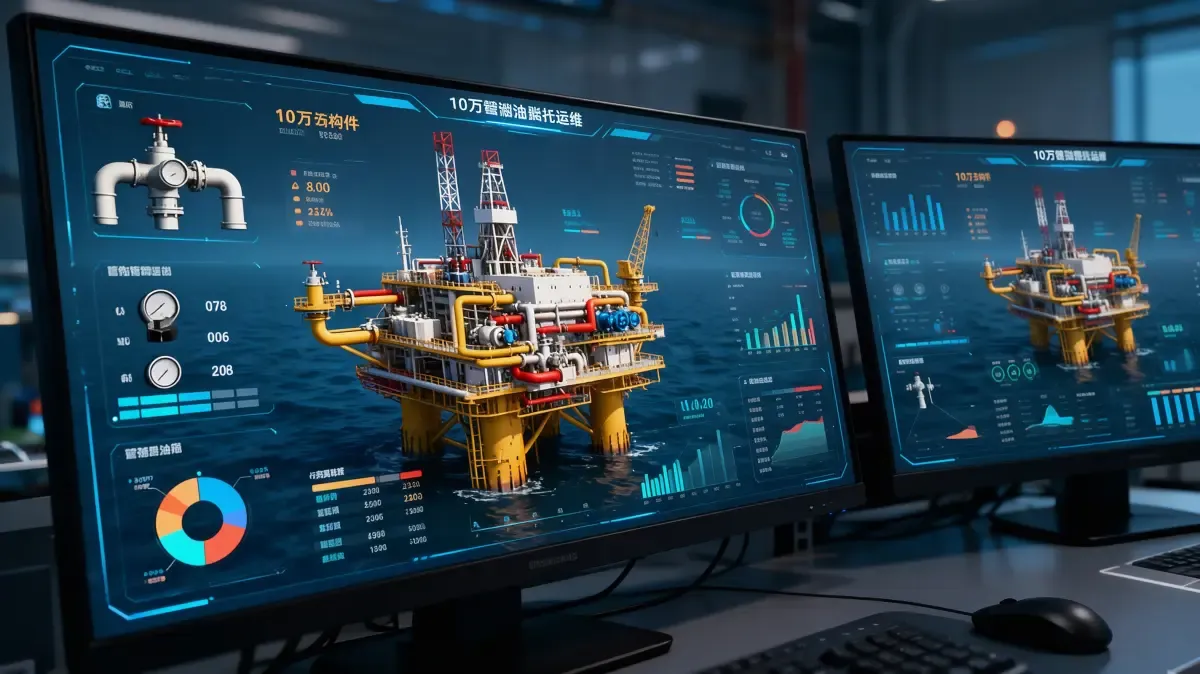
Digital Twin Visualization connects live data to site asset models for spatial visualization, keeping models continuously synced with real-world conditions.
Most plants have plenty of dashboards. What they do not have is a way to see where something is happening. Values arrive as charts and tables, and whoever reads them has to hold the layout of the plant in their head to know which of them matters.
Digital Twin Visualization binds live data to a model of the site — equipment, lines, areas and how they relate to each other. You look at where the equipment is and see what it is doing there, then go down a level when a question needs a single unit.
A model is only as good as what is attached to it. What can be shown depends on the model assets available and the data behind them. The software keeps the two attached and current; it does not invent detail that neither the model nor the data can support.
A chart tells you something changed. A model tells you where.
What it is
A structure, not a wall of charts. Areas, lines and equipment are placed where they actually are, with the relationships between them.
State shown on the equipment. Running condition, key values and faults appear at the position of the unit they belong to, rather than in a list somewhere else.
From overview down to one unit. Site, area, line, equipment — go as deep as the question needs, without switching system.
A moment you can go back to. Replay what the site looked like at a point in time, which is what an incident review actually needs.
Built on the same device record. It reads the device record held by RUIYI IOTS Platform rather than connecting to equipment separately.
Model assets come from you. Layout, equipment list and any existing drawings or models are supplied by the site; the software attaches live data to them.
What gets in the way today
Charts without location. A number arrives; where it belongs is left to the reader.
Values are presented as charts, with nothing to say where in the plant they sit. So importance has to be judged from memory.
Knowing which reading matters requires knowing the layout. Which new people do not, and experienced people carry in their heads.
Two readings with the same name in different areas are easily confused. And there is nothing on screen to say which is which.
Finding one thing takes too long. The answer exists; reaching it does not.
When something happens, the search runs across several screens. Each showing part of the picture.
People switch between control screens, reports and spreadsheets. And reassemble the situation by hand.
The person in the plant and the person in the office are looking at different things. So the conversation starts by agreeing what they are talking about.
Models that went stale. Bought once, then left behind.
A three-dimensional model was built, but nothing live was attached to it. So it became a demonstration rather than a tool.
The line was rearranged and the model was not. So people stopped trusting it, then stopped opening it.
Whoever maintained it has moved on. And updating it is nobody's job.
Different people, different pictures. No shared view to talk around.
Production, maintenance and engineering each use their own screens. So each arrives with a different version of the situation.
Meetings open by reconciling three sets of numbers. Before any decision is reached.
Anyone not on site has no way to see the plant at all. Which excludes the people often asked to help.
What it shows
Four levels, and the same data readable at any of them.
Level | What is shown there |
Site | The plant as a whole: which areas are running, which need attention |
Area | A building or zone: lines and utilities, and their current condition |
Line | A production line: equipment in sequence, and where it is held up |
Equipment | One unit: its state, the values that matter, faults and recent history |
What the model can show depends on what exists to show it. Where the site has layout drawings, an equipment list, or three-dimensional models, those are used as the base. Where it does not, a structured representation is built from the equipment record. The fidelity of the picture follows the assets available — the software attaches data to whatever model exists, and marks clearly what is live, what is last known, and what is not available.
What you get
Where it is used
What changes between these settings is what the model is built from and which level gets used most.
Setting | What visualisation is usually for |
Process plants | Following a route through vessels, lines and utilities, and seeing where a condition sits |
Discrete manufacturing | Line status at a glance, and drill-down to the unit holding things up |
Multi-site groups | A consistent way to look at any plant, so comparison does not depend on local habit |
New lines and commissioning | A shared picture while a line is being brought up, for people on and off site |
Utilities and infrastructure | Distributed assets placed geographically, where there is no single building to hold them |
Capabilities
Grouped by what they do. Data comes from RUIYI IOTS Platform; this application is about how that data is presented and navigated.
Capability | What it means |
Site structure | Model areas, lines and equipment as they are arranged in reality, and keep that structure in step with the device record. |
State on the model | Show running condition, faults and status at the position of each unit. |
Values in place | Display the readings that matter for a unit without leaving the view of it. |
Level navigation | Move from site to area to line to equipment, and back, without losing context. |
Replay | Return to a point in time and see what the site looked like then. |
Alarm display | Mark what needs attention on the equipment concerned, and let it be opened from there. |
Comparison view | Put two periods, two lines or two plants side by side on the same structure. |
Geographic view | Place distributed assets on a map where a building layout does not apply. |
Model asset handling | Use drawings, equipment lists or three-dimensional models supplied by the site as the base. |
Fidelity marking | Distinguish live values from last-known ones, and show clearly where data is not available. |
Annotation and sharing | Mark a view, add a note, and share it so discussion happens around the same picture. |
Roles and views | Give different roles the view they need, from an overview to a maintenance detail. |
Data source binding | Bind model elements to the points and devices held in the platform, with the binding recorded. |
Change tracking | Record changes to the model, so what changed and when can be answered. |
Deployment choice | Run in the cloud or on site, usually decided by where operational data may be processed and stored. |
Access and retention | Role-based access, retention set by policy, with access logged. |
How it works
Establish the structure. Areas, lines and equipment are set out as they are arranged, using the device record already held in the platform.
Attach the model. Drawings, equipment lists or three-dimensional models supplied by the site are used as the visual base where they exist.
Bind the data. Each element is bound to the points and devices behind it, and the binding is recorded.
Show the state. Condition, values and faults are displayed in place, at whatever level is being viewed.
Navigate and replay. Go down to a single unit when needed, or back to a moment in time to see what happened.
Keep it current. Changes in the equipment record flow through to the model, so the picture does not fall behind the plant.
What it depends on
The model assets. How detailed the picture can be depends on what the site can supply — layout drawings, an equipment list, or existing three-dimensional models. The software does not create detail that is not there.
The data behind it. What is displayed is what devices report through the platform. A value that no sensor produces will not appear, and elements without data are marked as such rather than filled in.
How current it is. How closely the picture follows the plant depends on how often the underlying data updates, which is a configuration and device matter, not a promise about the display.
What it does not do. It presents and navigates. It does not control equipment, and it does not replace the control system or the maintenance process behind it.
What is local. Where operational data may be processed and stored, who may see which views, and how long they are kept depend on the jurisdiction and the site. Configuration is set to fit them.